Hedge funds
Silver's two prices and the risk no one is modeling
Singleton retired close to nine-tenths of Teledyne's stock and earned the praise of Buffett. The instrument was ordinary. The timing was the whole thing.

Key Takeaways
Two prices, one metal. Exchange quotes and physical costs are diverging.
Supply can’t catch up. Five years of deficits with no fix coming.
Demand won’t flinch first. Solar, EVs, and AI lock in consumption.
Portfolio risk hiding in plain sight. Silver sits inside your holdings, unmodeled.
Record prices, fractured plumbing
Silver touched $111 per ounce in late January 2026. Within two weeks, it fell to roughly $76. The CME had raised margin requirements by nearly 50% in a single week, forcing leveraged positions to unwind and triggering the kind of liquidation cascade that makes headlines. Paper prices collapsed. Physical premiums barely moved.
That divergence deserves more attention than the price itself. As we explored in what markets can't agree on about gold, when credible sources can't converge on a commodity's trajectory, the disagreement itself can be viewed as a market signal. Silver's version runs deeper: the disconnect isn't between forecasters, it's between the price on a screen and the cost of obtaining the metal.
The price on the screen and the price at the dock
For most of the past half-century, silver's exchange price was a reasonable proxy for what the metal actually cost. That relationship has broken down:
Shanghai Gold Exchange physical silver trades at 12 to 13% above LBMA spot
The EFP spread between COMEX and London, historically about $0.25, widened past $1.05 during tightness episodes in late 2024 and 2025
Silver lease rates, normally 0.3 to 0.5%, spiked to more than 30 times normal levels during 2025's tightest episodes
As of early February 2026, one-month London rates sat at 6.3%, meaning borrowing silver for delivery costs more than most investment-grade corporate debt yields
The futures curve confirmed the stress by flipping into backwardation, near-term contracts trading above deferred ones, a structural signal that participants doubt sufficient physical supply will be available down the road.

820 million ounces short, and counting
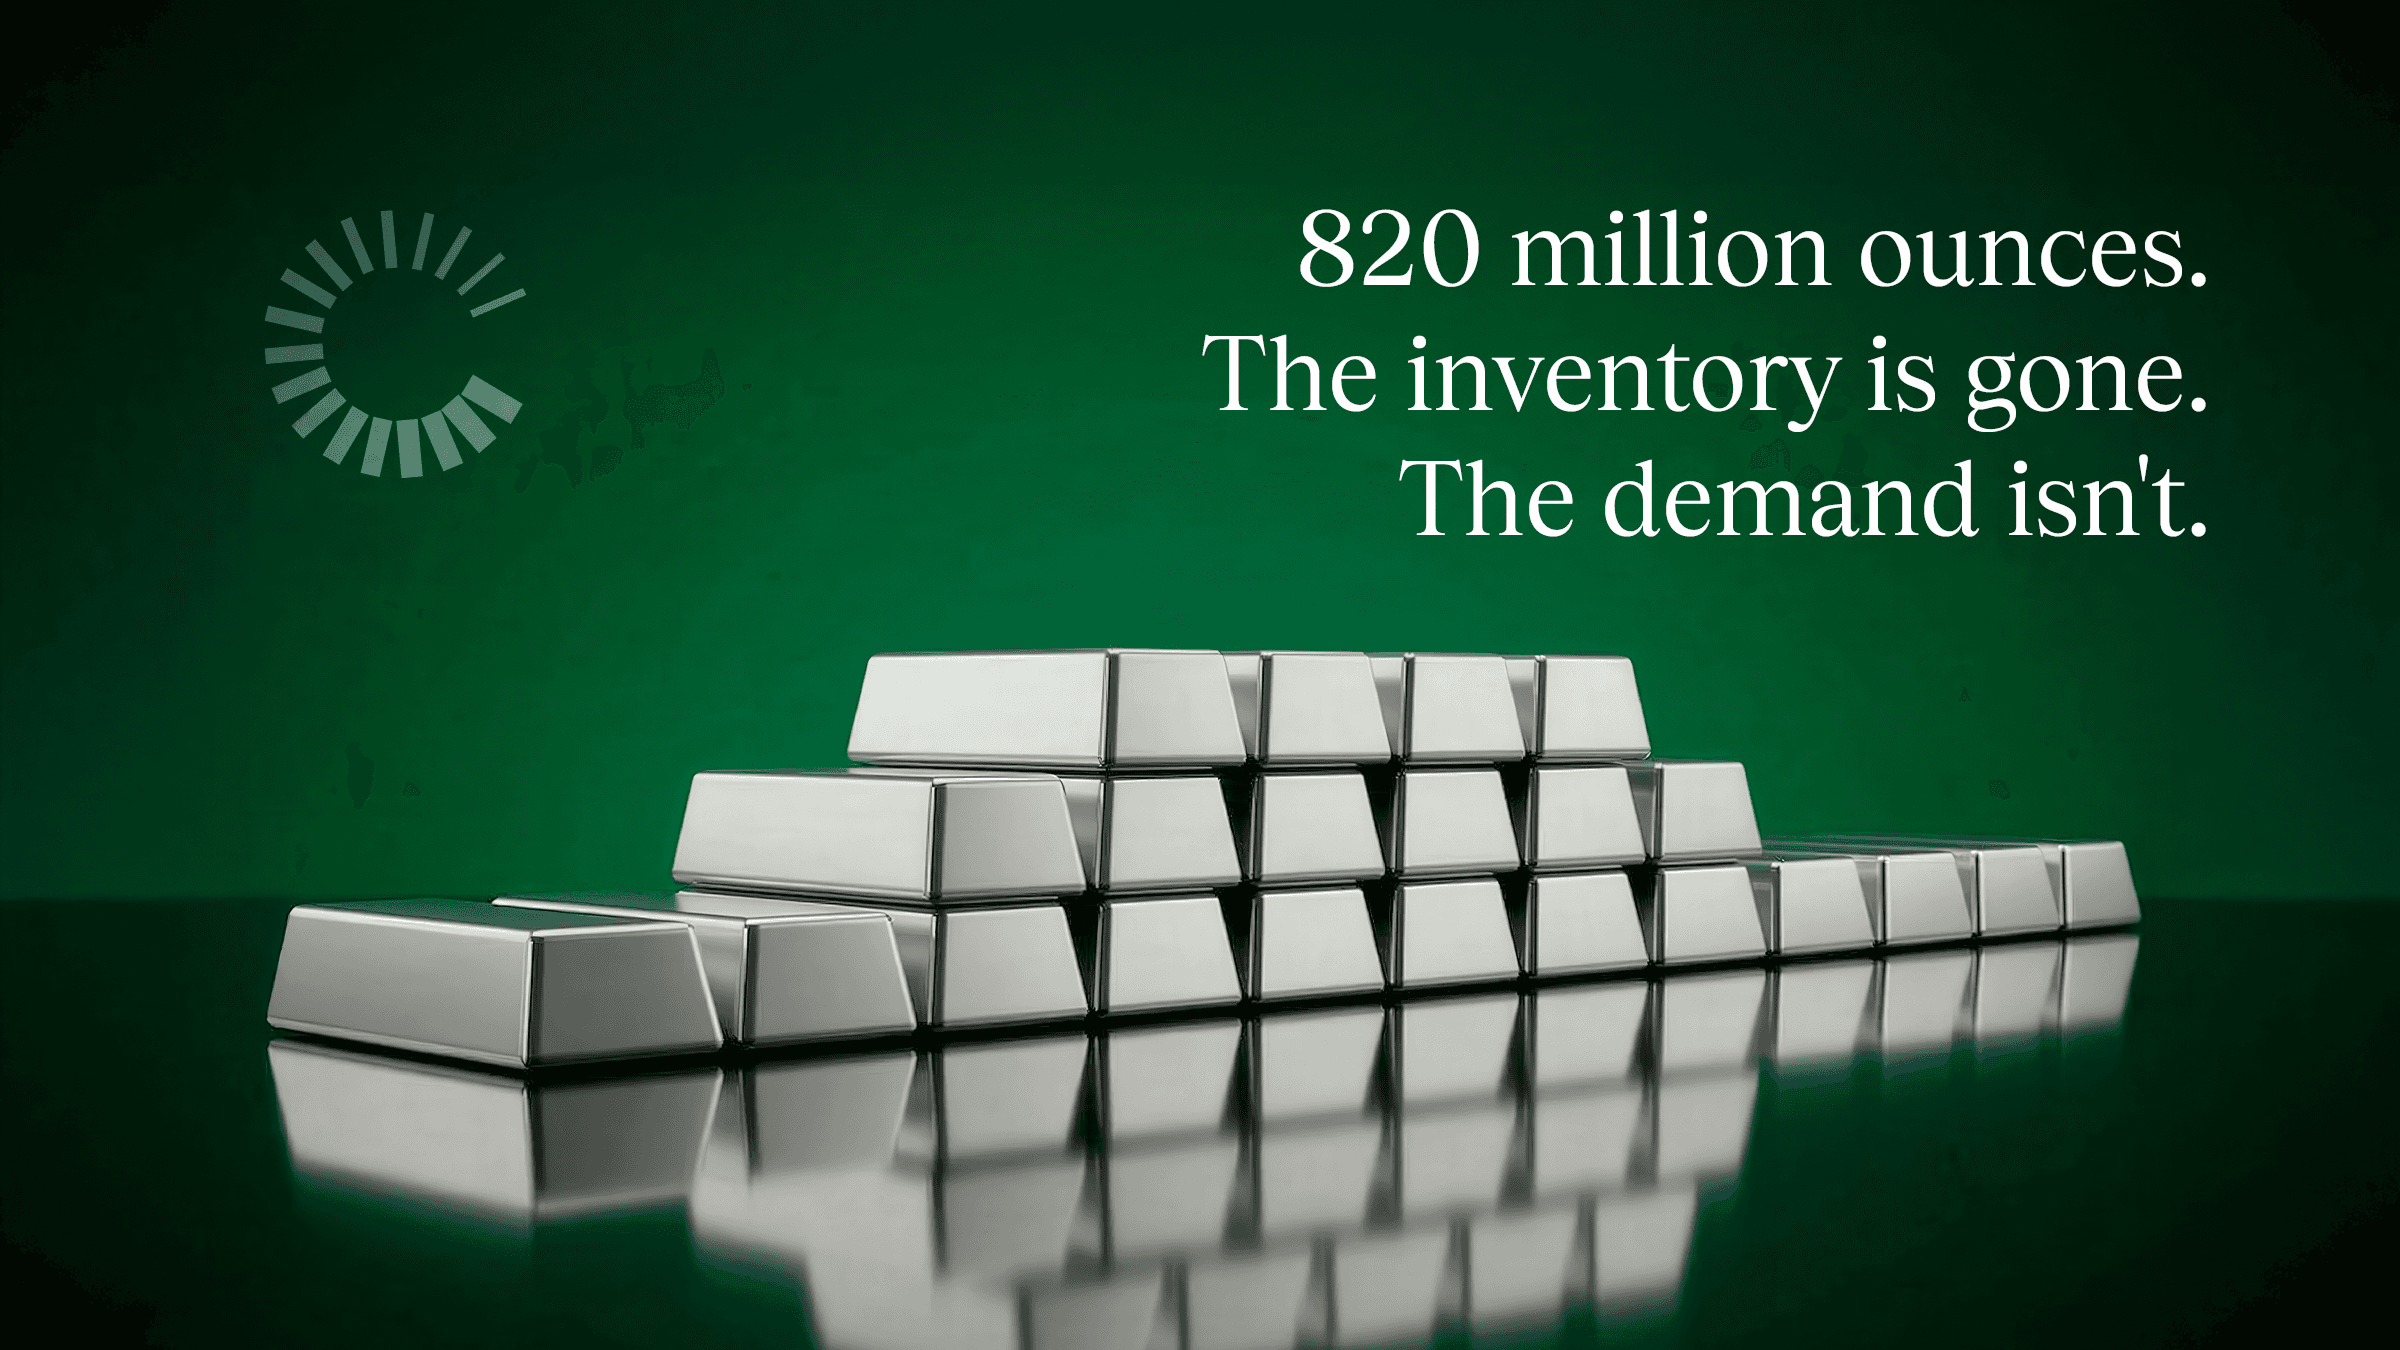
Silver has run supply deficits every year since 2021. The Silver Institute estimates cumulative shortfalls of roughly 820 million ounces through 2025, close to a full year of global mine production consumed from above-ground stocks.
How large was the 2025 deficit specifically? Estimates range from around 63 million ounces (Metals Focus) to 95 million (Silver Institute) to 230 million under broader methodologies. When credible sources disagree by a factor of nearly four, the market's transparency has eroded in ways that amplify risk for anyone relying on its signals.
Vaults are draining on both sides of the Atlantic
COMEX registered inventories have declined more than 70% from their 2020 peak, with delivery demand remaining elevated through late 2025. London has faced similar pressure, with LBMA vault holdings falling to roughly 155 million ounces by late 2025, down about 40% from 2021 levels.
Supply can't respond. Around 75% of global silver is mined as a byproduct of copper, zinc, and lead, meaning silver prices barely factor into production decisions. Even with prices surging, mine output stayed essentially flat at roughly 813 million ounces. New projects take seven to 10 years to develop, and ore grades at mature operations have been declining steadily, meaning miners process more rock for less metal.
China's refining chokepoint
In January 2026, China imposed export licensing on refined silver, restricting exports to 44 authorized companies with minimum production thresholds of approximately 80 tonnes. China mines only about 13% of global silver but refines 60 to 70% of it. During January through November 2025, the country exported roughly 4,600 tonnes while importing just 220.
That refining dominance gives the licensing regime outsized influence over how much finished metal reaches Western markets, and at what cost. The global silver market is increasingly fragmenting by geography, with Shanghai, London, and New York each carrying different premiums, inventory dynamics, and supply constraints.
The industries that can't switch away (yet)
Industrial fabrication hit a record 680.5 million ounces in 2024. The 2025 figure came in slightly lower, with the Silver Institute citing a decline of about 2% driven by tariff uncertainty and faster thrifting, but still the second-highest year on record. Three sectors anchor that demand:
Solar: The world added 380 GW of capacity in H1 2025 alone, a 64% year-over-year increase. Photovoltaic manufacturing now accounts for 29% of industrial silver demand, up from 11% in 2014.
EVs: Battery-electric vehicles use 67 to 79% more silver than combustion engines. The Silver Institute expects EVs to overtake combustion vehicles as the primary source of automotive silver demand by 2027.
AI and data centers: Silver sits inside semiconductors, power electronics, and high-performance computing hardware. The U.S. designated silver a critical mineral in 2025, placing it alongside rare earths and battery metals.
Where substitution is gaining ground
At $50 per ounce and above, weaker segments show strain. Jewelry demand fell approximately 4% in 2025, silverware dropped 11%, and physical bar and coin investment declined for the third consecutive year.
In solar, thrifting is real: asharp drop in per-module silver content means PV demand is forecast to ease around 5% year over year despite record installations. Copper plating technologies, while still a small fraction of production, could reduce silver loadings further within three to five years. The structural question is whether per-unit reductions can outpace deployment scale. So far, the answer has been no, but the race carries genuine uncertainty.
The cost assumptions that may already be wrong
Silver won't show up in a sector allocation breakdown. But it touches the cost structure of solar, EV, grid, and electronics holdings, which in many energy transition portfolios represent the majority of exposure.
The numbers have already moved. Silver has overtaken polysilicon as the single largest cost component in solar modules, now accounting for 16 to 17% of total module costs, while silver paste represents up to 30% of total cell costs.
FOB China TOPCon cell prices rose just over 30% from mid-December 2025, but module producers have struggled to pass through more than a fraction to end buyers. The result is margin compression built on pricing models that no longer reflect procurement reality.
The hedging gap
Standard hedging programs reference futures contracts. If those contracts trade at $76 while physical delivery requires $85 to $90, the hedge covers directional risk but misses the premium embedded in actual procurement.
The EFP spread between COMEX and London widened past $1.10 during 2025 tightness episodes, far above its historical $0.25 norm. Funds positioned across the themes outlined in our 2025 private markets outlook may find this exposure spanning multiple regions with diverging cost dynamics.

Separating the structural from the speculative
The 32% correction from January highs confirms that speculative mechanics still dominate short-term price action. Where silver's price goes next month is a trading question. Whether your portfolio's commodity cost inputs for silver-intensive sectors remain valid is an underwriting question. The first belongs on a trading desk. The second belongs in an investment committee room.
Five questions for the next investment committee
As capital moves toward energy transition and infrastructure, the assumptions embedded in those allocation decisions deserve scrutiny:
Does our infrastructure or energy transition exposure carry commodity input risk that doesn't surface in manager-level reporting?
Are the cost assumptions in our underwriting tied to exchange prices or actual procurement costs, and is anyone tracking the spread?
If physical silver premiums hold at 10% or more above exchange prices, what happens to the unit economics of solar or EV assets we hold?
How concentrated is our supply chain exposure to China's refining capacity, given the new export licensing regime?
Have we discussed commodity market structure risk at the IC level, or does it sit in a gap between the commodity team and the portfolio team?
The bottom line
Whether silver's physical tightness is a temporary dislocation or a structural feature of the market remains an open question. What's clear is that it belongs in an investment committee conversation, not as a commodity view, but as an input cost embedded in energy transition and infrastructure holdings that most allocation frameworks don't capture.
The managers who surface this exposure before their LPs ask about it will look prepared. The ones who discover it in a quarterly variance report will not. If your fund materials don't yet address how commodity input risk affects your portfolio's cost structure, Collateral Partners can help you frame that narrative clearly and credibly.